# [[Hill Charts]]
![[Hill Charts.svg]]
- Source: [[Shape Up]]
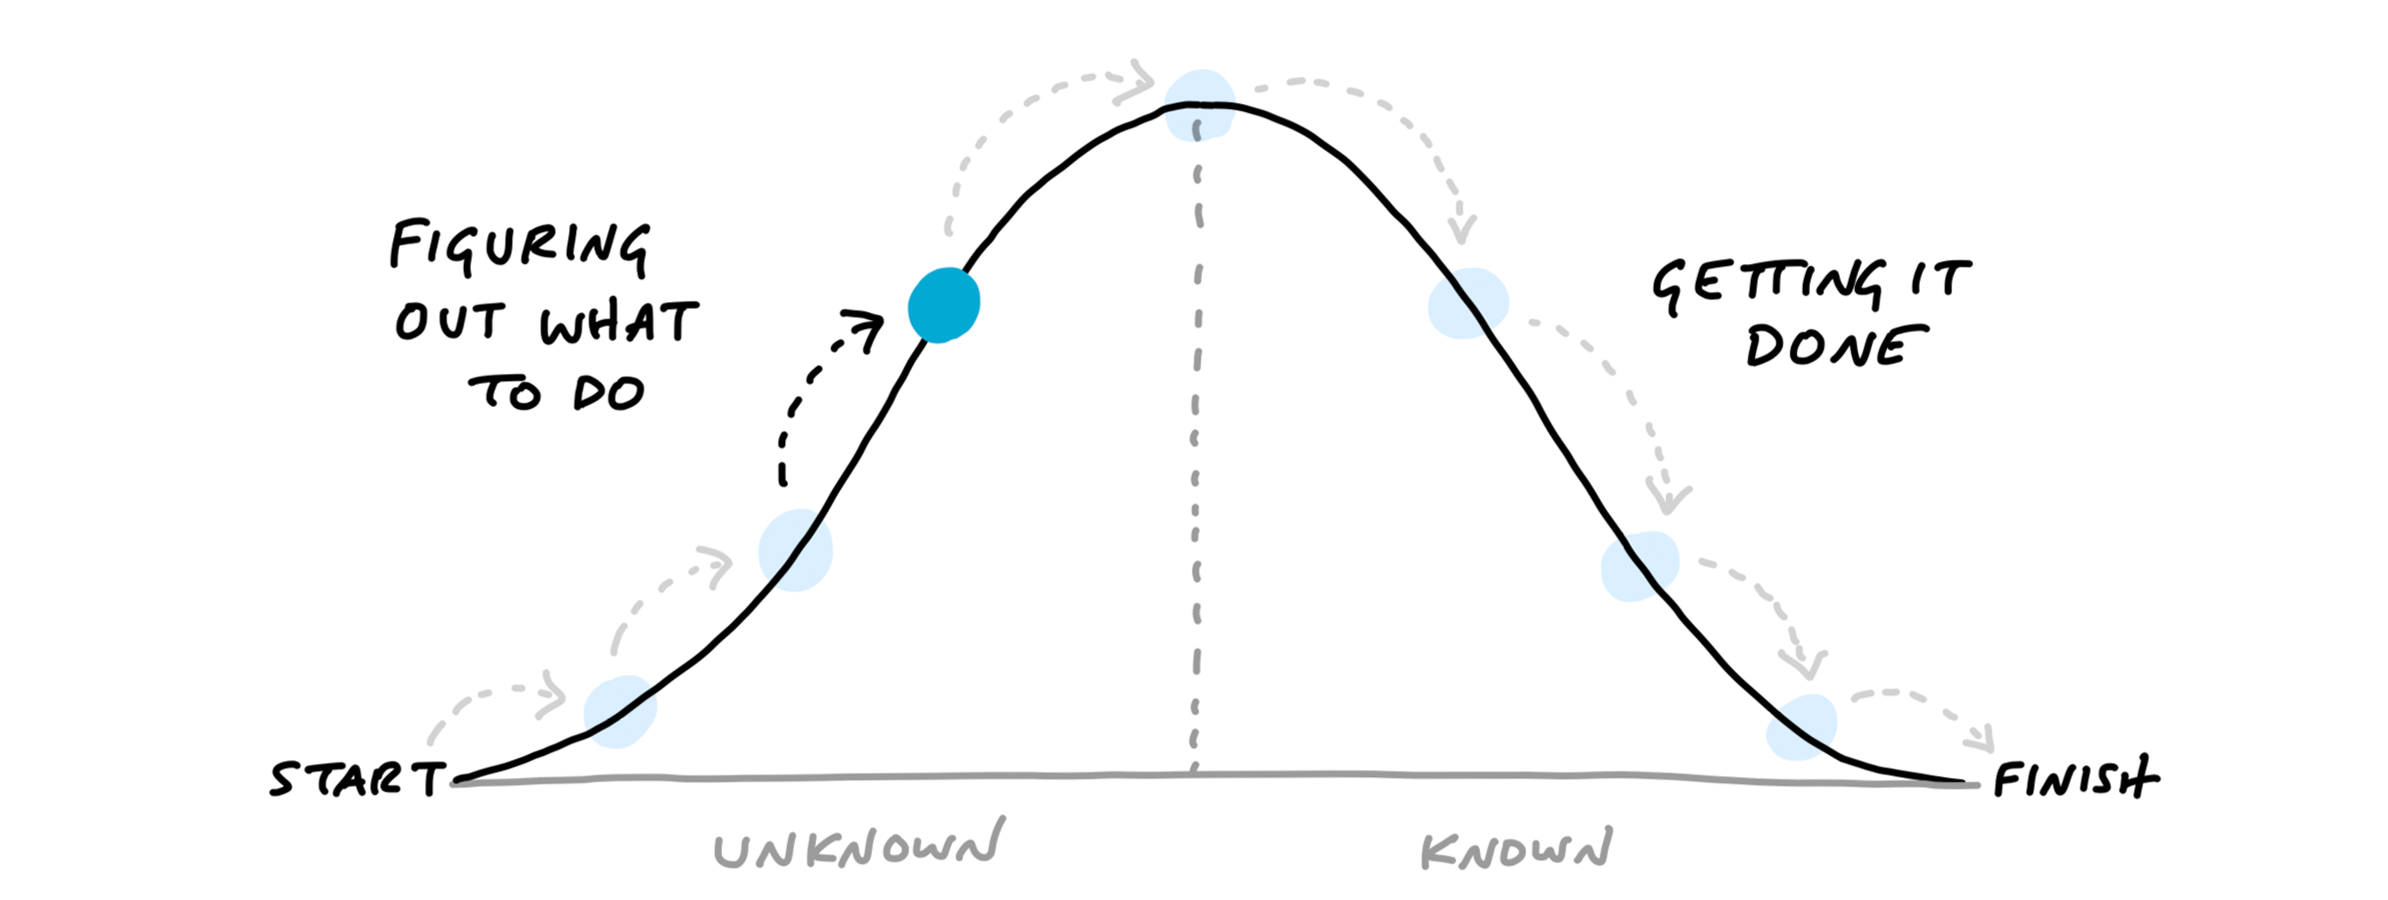
- Progress on a project can be difficult to communicate to stakeholders because there are a lot of unknowns at the beginning of a project. Traditional ways to show progress, like giving a percentage of work completed, presupposes knowledge of what that 100% will look like, which is unrealistic.
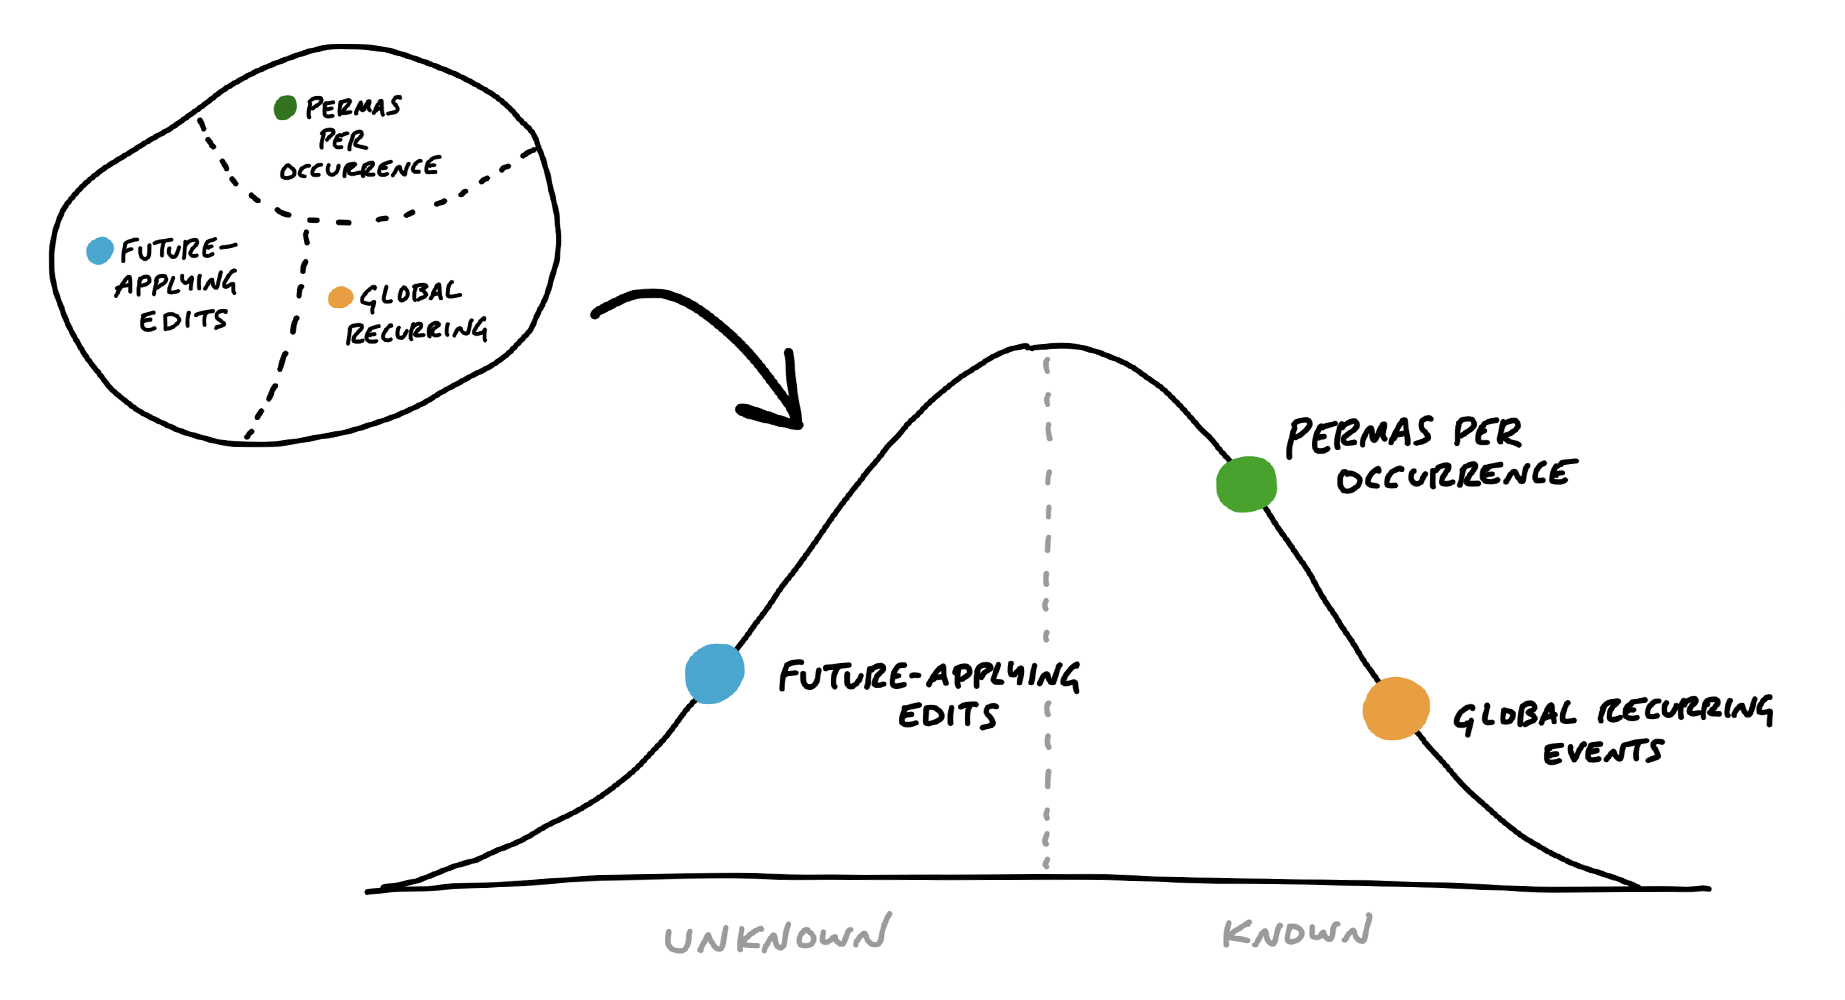
- Instead of estimating the percentage of work already completed, hill charts estimate how much of the work for each [scope](((jR2RUmn3G))) has been charted. Hill charts are, therefore, a map of uncertainty.
- "`we came up with a way to see the status of the project without counting tasks and without numerical estimates. We do that by shifting the focus from what’s done or not done to what’s unknown and what’s solved. To enable this shift, we use the metaphor of the hill`"
- "`Every piece of work has two phases. First there’s the uphill phase of figuring out what our approach is and what we’re going to do. Then, once we can see all the work involved, there’s the downhill phase of execution.`"
- ""
- ""
- [Other ways to give status updates]([[Ways to give status updates]])
- "In [[Basecamp]], you can create hill charts and view past states"
- ""
- "`For managers, the ability to compare past states is the killer feature. It shows not only where the work stands but how the work is __moving__.`"
- "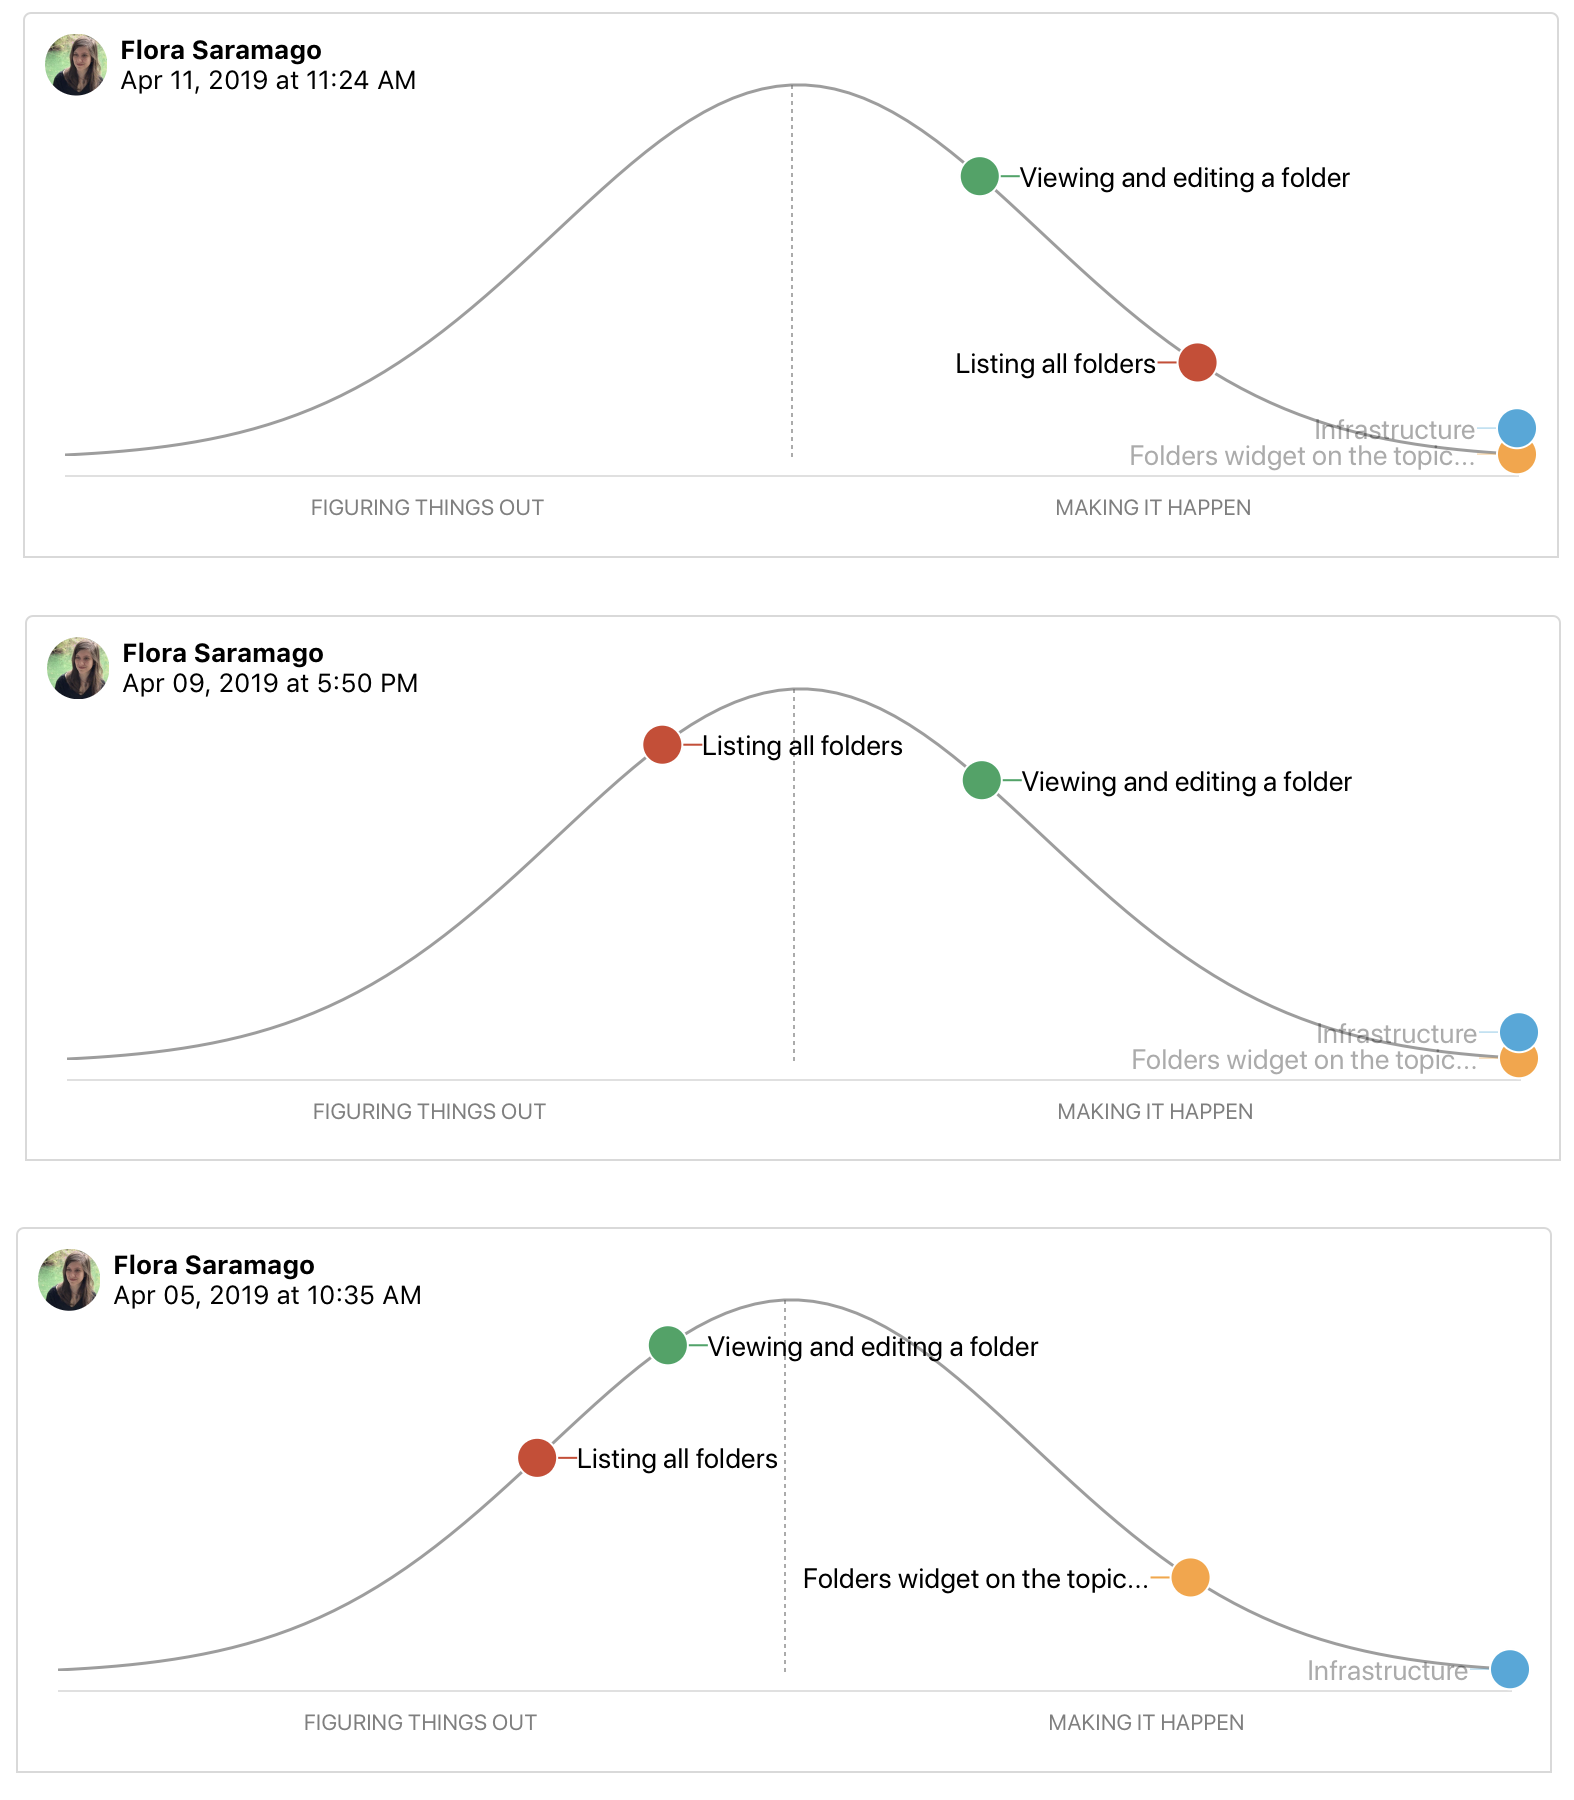"
- Being able to view past states allows managers or other members of the wider team to see when there are obstacles that prevent a scope from not moving [uphill](((U3VPt_CMx))).
- "`Some teams struggle with backsliding when they first try the hill chart. They consider a scope solved, move it the top of the hill, and later have to slide it back when they uncover an unexpected unknown. When this happens, it’s often because somebody did the uphill work with their head instead of their hands.`"
- "Seeing how hill charts change over time can identify when the team gets stuck on a scope or when the scope was too big in the first place. Having smaller scopes is essential to being able to see meaningful progress."
%%
# Excalidraw Data
## Text Elements
## Drawing
```json
{
"type": "excalidraw",
"version": 2,
"source": "https://github.com/zsviczian/obsidian-excalidraw-plugin/releases/tag/2.1.4",
"elements": [
{
"id": "4y8R7iOA",
"type": "text",
"x": 118.49495565891266,
"y": -333.44393157958984,
"width": 3.8599853515625,
"height": 24,
"angle": 0,
"strokeColor": "#1e1e1e",
"backgroundColor": "transparent",
"fillStyle": "solid",
"strokeWidth": 2,
"strokeStyle": "solid",
"roughness": 1,
"opacity": 100,
"groupIds": [],
"frameId": null,
"roundness": null,
"seed": 967149026,
"version": 2,
"versionNonce": 939059582,
"isDeleted": true,
"boundElements": null,
"updated": 1713723615080,
"link": null,
"locked": false,
"text": "",
"rawText": "",
"fontSize": 20,
"fontFamily": 4,
"textAlign": "left",
"verticalAlign": "top",
"containerId": null,
"originalText": "",
"lineHeight": 1.2
}
],
"appState": {
"theme": "dark",
"viewBackgroundColor": "#ffffff",
"currentItemStrokeColor": "#1e1e1e",
"currentItemBackgroundColor": "transparent",
"currentItemFillStyle": "solid",
"currentItemStrokeWidth": 2,
"currentItemStrokeStyle": "solid",
"currentItemRoughness": 1,
"currentItemOpacity": 100,
"currentItemFontFamily": 4,
"currentItemFontSize": 20,
"currentItemTextAlign": "left",
"currentItemStartArrowhead": null,
"currentItemEndArrowhead": "arrow",
"scrollX": 583.2388916015625,
"scrollY": 573.6323852539062,
"zoom": {
"value": 1
},
"currentItemRoundness": "round",
"gridSize": null,
"gridColor": {
"Bold": "#C9C9C9FF",
"Regular": "#EDEDEDFF"
},
"currentStrokeOptions": null,
"previousGridSize": null,
"frameRendering": {
"enabled": true,
"clip": true,
"name": true,
"outline": true
}
},
"files": {}
}
```
%%